Tide tables generally get us pretty close—usually within seven minutes for timing and a few centimeters for height. But why aren’t they perfect? Well, nature throws curveballs like storms and shifting coastlines, and our math relies on historical data that might not capture every change. We use harmonic analysis, breaking tides into waves summing up local patterns, but smaller or remote ports can be tricky. Curious how all these bits fit? Keep exploring—you’re on the tide to understanding it all!
Key Takeaways
- Tide tables are generally accurate within about 7 minutes for low tide timing predictions.
- Accuracy depends on quality and length of historical tidal data used in harmonic analysis.
- Local factors like coastal geography and meteorological conditions can cause deviations in actual tides.
- Prediction models improve by incorporating multiple tidal constituents and real-time environmental data.
- Minor and remote ports tend to have less accurate tide tables due to limited data and monitoring.
Accuracy Metrics Used in Tide Prediction
While we might take tide predictions for granted when planning a beach day, their accuracy actually depends on some pretty neat metrics. Did you know the average error for low tide timing is just about 7 minutes? That’s surprisingly precise! Accuracy assessment involves calculating these small differences between predicted and observed tides, often using Root Mean Square (RMS) errors—fancy math that just means measuring how far off predictions are on average. But tides aren’t set in stone; prediction improvements come from adjusting for sea level rise and atmospheric pressure changes daily. Plus, scientists use multiple models and real-time data to fine-tune forecasts. So, next time you check a tide table, remember, there’s a lot of clever number crunching behind that seemingly simple chart keeping us informed and safe!
Factors Affecting Tide Table Accuracy
Even though tide tables might seem like straightforward schedules, there’s actually a lot that can throw off their accuracy. For starters, instrument calibration is essential—if tide gauges aren’t perfectly synchronized or zeroed, we get skewed readings. Then, meteorological influences like sudden storms or changing air pressure can push water levels around unpredictably. Have you ever noticed how coastal shapes affect waves? That’s geographic features at work—bays and underwater contours can amplify or soften tides, making each spot unique. And let’s not forget data quality; poor or short records mean we might miss long-term tidal patterns, adding uncertainty. So, tide tables are hitching a wagon to many moving stars—both natural and technical—and understanding these factors helps us appreciate the science behind each prediction.
Impact of Dataset Length on Tide Predictions
As we explore how dataset length impacts tide predictions, you might wonder why having more data actually makes a difference. Well, it all boils down to dataset reliability. Longer datasets—think years instead of weeks—let us capture more of those tricky tidal harmonic patterns that shape how tides rise and fall. When we only use short datasets, we’re basically trying to solve a puzzle with missing pieces, which can lead to overestimating extremes like the Highest Astronomical Tide. Plus, short records struggle to account for natural ups and downs, like storm surges or seasonal shifts, muddying our predictions. So, by gathering tides over time, we get steadier, more trustworthy forecasts. It’s a bit like tuning an instrument; the longer you play, the better you understand the music!
Methods Behind Tide Prediction Calculations
Since tides follow pretty predictable rhythms, we can actually break down their patterns using something called harmonic analysis—it’s like taking the tide’s complex dance and simplifying it into a mix of waves, each with its own beat. These waves, or tidal constituents, like M2 and S2, each have their own frequency and size, which we combine mathematically to forecast tides. Using harmonic analysis, we sum these constituent waves to create a tide prediction model that captures the rise and fall of the water. Scientists gather local water data to fine-tune these models because every place has its own unique set of harmonic constants. It’s a bit like learning everyone’s favorite dance moves before hitting the floor—getting it right means the tide tables will be much more reliable for all of us who count on them.
Understanding Discrepancies in Tide Time and Height
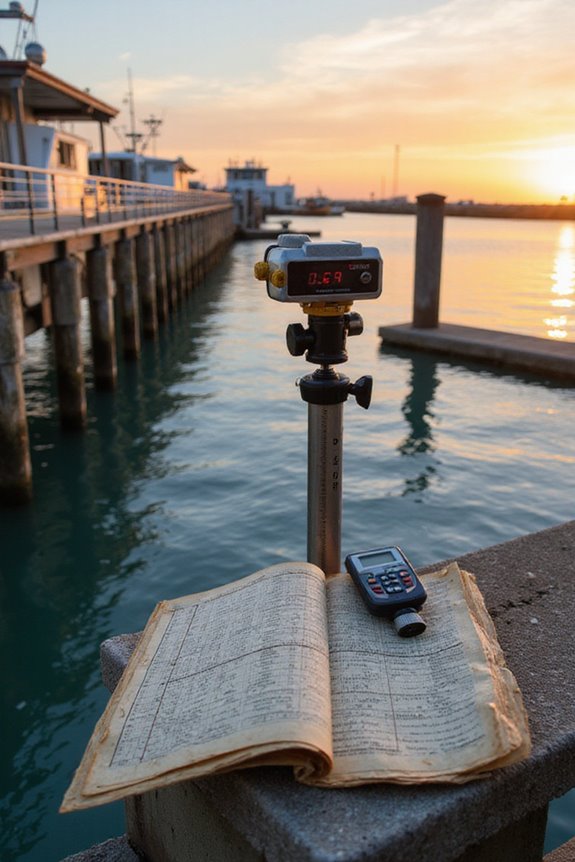
While we might expect tide predictions to line up perfectly, the truth is, discrepancies in tide times and heights pop up more often than you’d think. Different prediction methods, like harmonic analysis versus approximations from nearby spots, can give us slightly varied results. Plus, tidal fluctuations influenced by weather or river runoff don’t always show up in the numbers. Have you noticed tide heights sometimes change slowly around high or low water? That’s why a 10-15 minute difference often means just a tiny height shift—smaller than what rounding can exaggerate. And let’s be honest, even the best tide tables can’t predict every gust or rainstorm that tweaks the tide. So, when your boat rocks a bit differently than expected, you’re actually in good company!
Challenges in Predicting Tides at Minor and Remote Ports
Predicting tides at minor and remote ports isn’t as straightforward as you might think, and we’ve all probably noticed the odd quirks when relying on tide tables in those spots. The minor port challenges stem from limited historical data and less detailed modeling, since local bathymetry—the sea floor layout—can change frequently. Remote port limitations add to the mix: fewer instruments and no real-time updates make it tougher to track sudden weather impacts or sediment shifts. Ever wonder why tides seem unpredictable there? It’s partly because smaller ports often lack the tech and funding to keep tide data fresh and accurate. So, while major ports enjoy excellent forecasts, the smaller ones face an uphill battle adapting to complex local conditions, which keeps us sailors and dockworkers on our toes.
Practical Implications for Tide Table Users
When we use tide tables day to day, it’s easy to overlook how much guesswork is built into those neat little numbers. They give us a solid starting point, but we need to set our user expectations right—weather shifts, local runoff, and rounding can all nudge tide times and heights off by a bit. If you’re working near a minor port, user adjustments become even more essential, since predictions often depend on nearby major ports and some educated interpolation. So, treating tide tables as approximate guides—not crystal balls—is wise. Whether docking or fishing, recognizing these limits helps avoid surprises. After all, isn’t it better to be a little cautious than caught off guard because we trusted numbers without a backup plan?
Frequently Asked Questions
How Often Are Tide Tables Updated or Revised?
Let’s look at live updates and latest lessons: tide table accuracy depends deeply on diligent data. Revision frequency varies—mostly annual but sometimes weekly—ensuring we share freshly synchronized, safe, and sensible sea schedules with our trusty tide-timing tribe.
Can Tide Tables Predict Storm Surges or Tsunami Effects?
We can’t rely on tide tables for storm surge or tsunami prediction since they don’t account for atmospheric or seismic forces. Instead, specialized models and real-time data are essential for accurately forecasting these extreme water events together.
What Tools or Apps Provide the Most Accurate Tide Predictions?
Curious which tide prediction tools we trust most? For mobile tide apps, we lean on NOAA-based ones and Rise—they combine accuracy with smart features. Join us, and let’s explore tides together confidently.
How Do Moon Phases Influence Tide Heights and Times?
It is understood the moon’s influence on tidal patterns is key—its phases dictate spring and neap tides, causing higher or lower tides. Together, we can track these shifts, feeling connected to the ocean’s natural rhythm and timing.
Are Tide Tables Useful for Fishing and Boating Safety Planning?
We’re all sailors steering through nature’s pulse, and tide tables are our compass. By trusting their tide timing, we boost fishing success and keep safety in check, sharing the rhythm of the sea as one united crew.

